Greater Chennai · 30 m Landsat · 2016–2026
Where Chennai Bakes
Some streets in this city run four degrees hotter than others on the same morning. Not because the weather is different — because of what the ground is made of, and how far it sits from the sea. Search your street, your neighbourhood or your ward.
The heat map
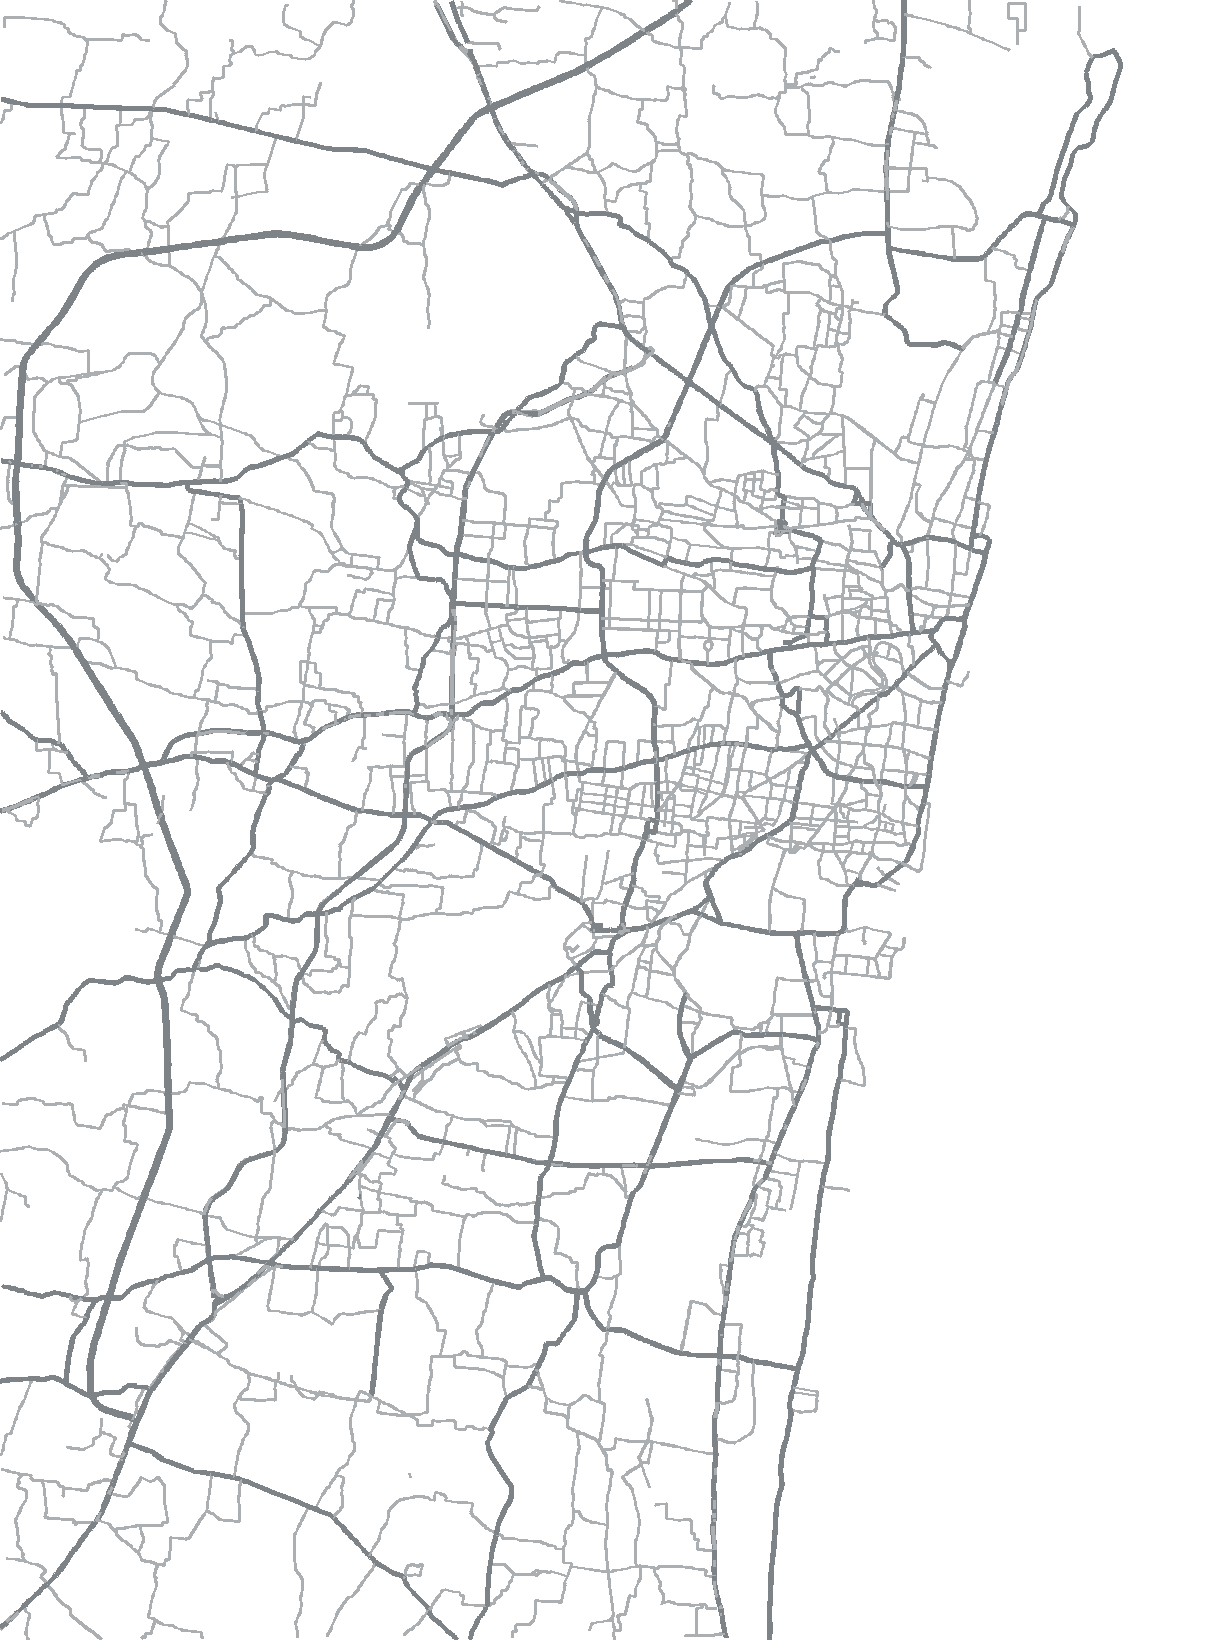
Colour shows how much hotter or cooler each patch of ground is than the half-kilometre around it, on the same morning. Not hotter than the city — hotter than its own neighbourhood, which is the part a roof or a row of trees could change. Roads are drawn on top so you can find your way around.
The ranking
Hottest first, for the view selected above. Pick any row to place it on the map.
Heat by area
The same data, summarised instead of pixel by pixel. Choose what to divide the city into, and which morning to measure. Averages compress the range, so this map has its own scale — the numbers under it say what the colours mean.
Fifty places, and what would actually help
The maps above say where the ground is hot. This says why, place by place — what each one is made of, and which measures have evidence behind them there. The figure is against the city average rather than the local surroundings, because that is the comparison a city-wide shortlist has to be made on.
Each dot is one of the fifty places, sized and coloured by how far it sits from the city average.
What actually makes a place hot
Every type of land, measured at its own distance from the sea, on the same local scale as the map above. Reading down a column compares land types in the same setting; reading across a row shows what the coast does to one type of land. Both matter, and the coast matters more than most people expect.